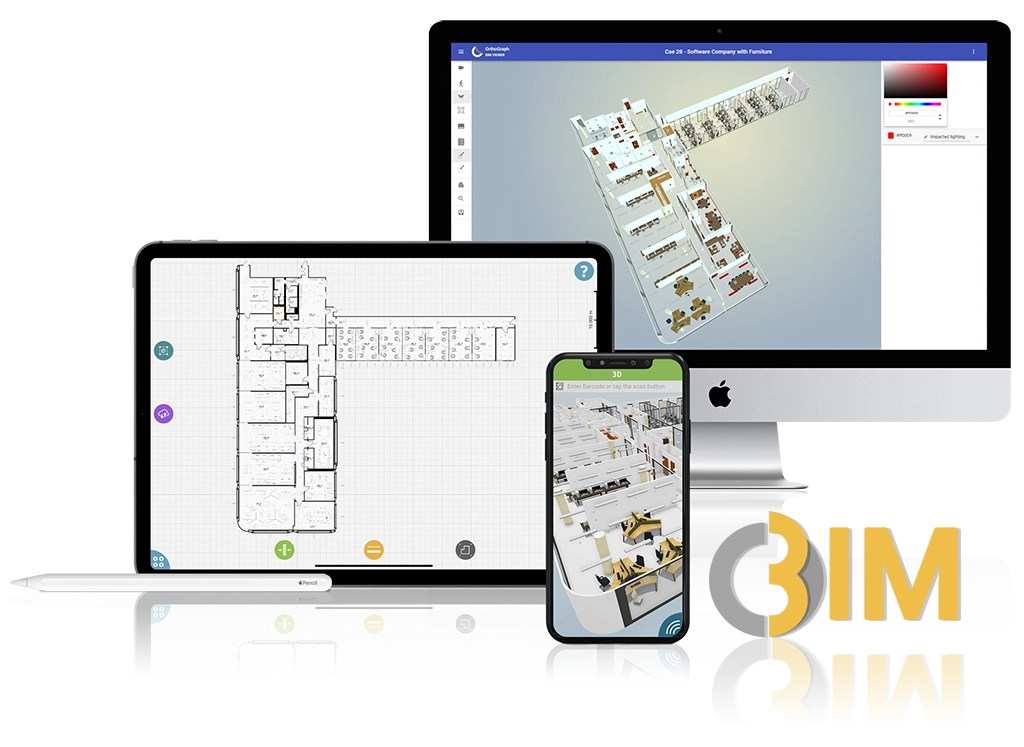
OrthoGraph was planned and developed in supporting facility operation in mind. Graphical reporting in the web viewer is one of the key features of the system.
OrthoGraph’s web viewer can be used to manually colorize both locations or objects. In addition if the graphical viewer of OrthoGraph is embedded / connected to any third-party system, then these systems can run graphical colorization reports on the model on the client-side. This makes it possible even to run live, real-time colorization functions on the 2D/3D model making it possible to integrate the graphical model even with building automation systems too.
Please note: OrthoGraph’s API and graphical web viewer is available for free to integrate and use.
Interested? Start getting in control today!
to our Newsletter
OrthoGraph
Contact us
Contact us
OrthoGraph GmbH
Gartenstrasse 7
Zug
Switzerland
6300
+ 41 (41) 5510150
9:00-18:00 Zurich Time
USA: +1 760 933 1550
UK : + 44 (20) 34119438
Other pages
Education
Rapid Survey Concept
Orthograph for Constructions
Historical Building Survey

Recent Comments