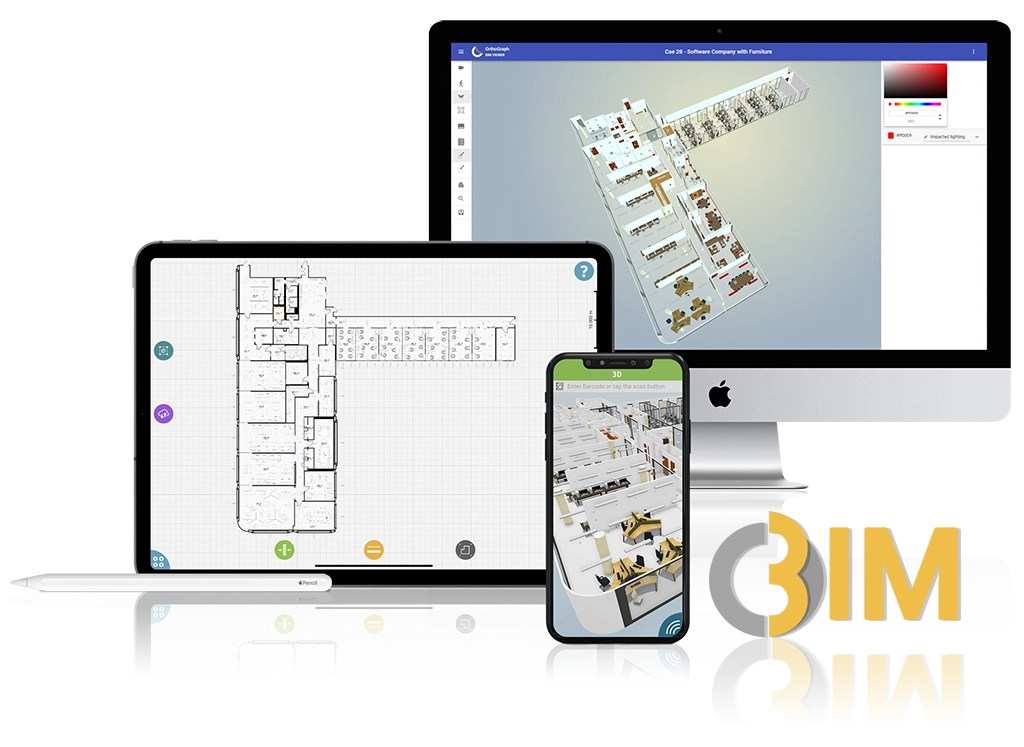
OrthoGraph Cloud Access

OrthoGraph BIM models are available on mobile platform and also in a web browser. OrthoGraph Cloud Access is the functionality that provides access to the graphical models in 2D and 3D by using a simple web browser like Google Chrome or Safari on Mac.
While accessing the graphical views of the BIM models all the attached properties are also accessible. For elements like locations calculated data (net and gross area, rentable or cleaning area) are also all available. There is nothing more to do than just simply click any element and then open the properties view to access all attached data.
This web functionality can also be embedded into any external system to make the BIM compatible. Clicking the Open button at any connected element will bring up the external system let it be a facility management system, a maintenance management system or a building automation system. This also works vice versa: requesting the OrthoGraph web viewer to display an element from any external system is just a click. OrthoGraph Cloud Access will locate the requested element and then display it on the floor plan or in 3D, the one you prefer more.

By using barcode technology to identify the elements you can simply search for them in the web browser. OrthoGraph Cloud Access will display the element in an instant in the graphical model.
To refer to elements for easy communication with your colleagues use direct links to those elements. These links behave the same way on mobile devices and in desktop environment: they will display the requested element instantly, graphically. To create such reference links you don’t need to do more than click the graphical element and click the top right icon of the OrthoGraph Cloud Access viewer. A link to the actual element will be copied onto the clipboard of your computer, then you can do anything with that: send it via e-mail, store it as a reference in an excel sheet or in an external, independent system.
OrthoGraph Cloud Access is also the place of graphical reporting. Displaying colorized reports on the floor plan to represent tenants or temperatures of locations by color, or in some cases to display the amount of visitors at a location in a shopping mall graphically is simple and convenient. In addition to colorizing locations, colorizing elements is also possible. To display fan-coils generating the most electricity usage graphically or to highlight CO sensors or air filtration systems in a hospital that reported problems is possible not just on the floor plan but also in 3D to allocate them fast and conveniently.
Displaying alphanumeric data on the floor plan is also supported. To display measured values at elements, or people sitting in a room using their ID cards from the access management system is simple and convenient.
The possibilities are endless, they depend only on the integrations set up, the data captured or calculated and the user demands. This is something that is not required to be done in one go, but developed continuously as demands occur.
to our Newsletter
OrthoGraph
Contact us
Contact us
OrthoGraph GmbH
Gartenstrasse 7
Zug
Switzerland
6300
+ 41 (41) 5510150
9:00-18:00 Zurich Time
USA: +1 760 933 1550
UK : + 44 (20) 34119438
Other pages
Education
Rapid Survey Concept
Orthograph for Constructions
Historical Building Survey
