OrthoGraph Helps Saving
the Increased Costs of Energy Crisis

At the beginning of 2022, no one thought that the energy crisis would be the reason that the operation of buildings would have to be significantly reconsidered.
That time, energy costs typically did not exceed 10% of the total real estate operating costs. Although many expressed the need for greener operations, this was only nice to have, perhaps a plan among many others, rather than a forced expectation.
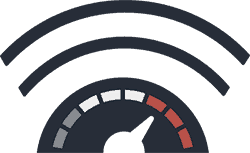
With the emergence of the energy crisis, such unexpected, unplanned costs have appeared that cannot be simply swept aside. In all corporate sectors, these must be dealt with as soon as possible, otherwise not only the competitiveness of the given company deteriorates, but also some activities or the whole operation of the entire institution may become completely impossible.

Many people reach for cutting functions, partial closures as a solution, but this not only means the immediate regression of the given company, but in many cases it is not even a real possibility, because it makes their main activity impossible. Closing dormitories in the case of universities, transferring complete departments to distance learning, closing hotels and restaurants at least for the winter period are steps that, if at all, can be reversed. Even then only during only in a long time and very painfully. In connection with COVID, we saw that even after the reopening, industries were completely overwhelmed by the disappearance of the workforce, since many people retrained themselves during the virus period and, “thank you very much, they prefer to stay where they are”. And then we are not even talking about the problem of losing customers, which can be very difficult to rebuild later.

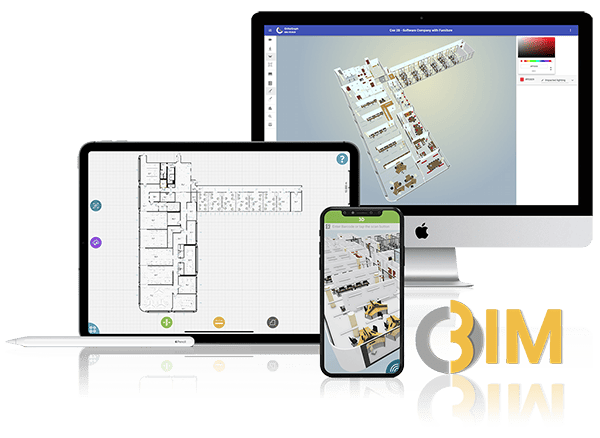
We would not even imagine how much cost reduction and an immediate solution to the management of the energy crisis is the production of operational BIM with real data. Even much more than that will all the other possibilities based on it.
We often get the answer that this requires yet another investment, which is partly true, but there are financial solutions that can be used if there is no available funds. They can also be implemented in an ESCO model or safely with a loan as savings are well plannable, and the saved energy budget can be immediately sold to the market for additional revenue in addition to not paying for the high consumption anymore. This further improves the savings results.
This article is one of the best examples of how OrthoGraph operational BIM is much more a financial than an architectural digital twin solution – even tough it’s as good for it e.g. for window modernization too.

Let’s look at some examples where the creation of operational BIM produces immediate results, and please think out of the box about the building data, and look for the help in an ecosystem:
Lighting furniture refurbishment
In case of many companies, universities, schools, shopping malls, etc. the lighting is one, if not the biggest, electricity consumer. With lighting renovation, not only can significant savings be achieved on electricity consumption (typically 51-65% compared to a neon based, outdated system), but at the same time the service level, i.e. the lighting of rooms, can also be raised where it is not adequate today. This can be further improved by using “smart lighting”, i.e. using presence sensors as the most obvious solution.

Operational BIM can provide in a few days or weeks an accurate floor plan and a detailed graphic lighting fixture inventory, condition survey for properties as large as 10,000 to 100,000s m² (100,000 to 1000,000 sqft). With this, the lighting redesign, calculations and tendering can be realized in weeks, often even days. Here, by plans we mean not only the technical implementation, but also a precisely planned reduction in consumption, which results in plannable savings. In addition the remaining reserved consumption budget itself can also be sold. Don’t forget the added value that the maintenance need of LED lighting fixtures is typically a fraction of that of traditional lighting fixtures.

Opening schedule
Speaking of graphic inventory, we shouldn’t forget one of the most trivial ways of energy reduction: replacing windows and doors. Replacing everything of course is often not the best solution, it is not only a large investment, but it can also significantly disrupt the operation of the institution.
Using OrthoGraph’s graphic inventory features, doors and windows can be recorded graphically very quickly, along with their positions, dimensions, conditions, and thermal insulation parameters. With the newest release of OrthoGraph thermal images can also be attached to each individual opening by using the integrated thermal camera support of OrthoGraph. Within a few days from the beginning, this gives us the opportunity to assess which windows and doors should be repaired or replaced to reduce the heating bill the most and which ones can be the cooling demand reduced with minimal investment simply by installing shades.

As individual parameterization of particular devices, i.e. for example the exact recording of conditions, is an integral part of Operational BIM, with the help of OrthoGraph’s Excel output it is really easy to prioritize and thus focus on those doors and windows, the replacement of which will result in the greatest energy reduction with the smallest investment. This is also helped by the feature that if a north sign with the appropriate orientation is placed in the model, this orientation information will be included in the Excel output for each door, window, and wall, thereby helping energy-saving planning – whether in the case of replacement of doors or windows or also in the case of wall insulation.

Graphical asset inventory of large consumers
The fact that you already have existing air conditioners, air handling units, boilers, compressors and other large electricity or gas consumers does not mean that it is worth keeping them as they are today. The current increase in energy prices makes the replacement and revision of out-of-date equipment very competitive and obvious.

With the help of Operational BIM, in addition to the floor plans, the exact location, condition, task performed, type, power consumption or gas consumption of the equipment can be recorded, and the modernization investment and its return is to be planned instantly. The new integrated thermal image feature of OrthoGraph gives additional information about the equipment to make the minimum required renovation or the right decision towards energy consumption reduction. In this way, we should not replace everything, but only those ineffective large consumers that is the minimum required in order to achieve the fastest return.
Where it is uncertain whether a consumer performs well or not, those consumers can be easily measured, “smartened up”, which gives instant control in the ecosystem with immediate accurate analysis. Use the Operational BIM for the equipment inventory, the installation of smart meters or the smartening of existing ones to provide real consumption data instantly. Use of analytical applications and energy consultants on this data lets you make the right decisions rapidly. This opportunity provides spectacular results both in the short and long term.
Here, as before, in addition to the savings, the remaining energy budget can be sold and results in additional immediate revenue.
Smarting meters and inserting sub-meters, cost allocation
We all know that what is “free”, i.e. we get it without limits, nobody pays attention to it. How many times do we see institutions where the windows are open in addition to the roaring air conditioner, or where the radiators heat at maximum. Many times, air conditioners that are left on for the weekend cool unused rooms, or even large consumers, manufacturing or other equipment left on alone without use. It’s even worse when, for example, due to the omission of a simple filter change, a fan coil tries to transfer the desired amount of air or reach the desired temperature in the room with its maximum performance, thereby not only generating high consumption, but also significantly shortening its lifespan.
Technology already exists today with which within minutes – and we mean this literally – smart meters can be installed and i.e. filter conditions can be made measurable, the saturation or the operation of the equipment can be detected, e.g. with measuring if the windows are left open.
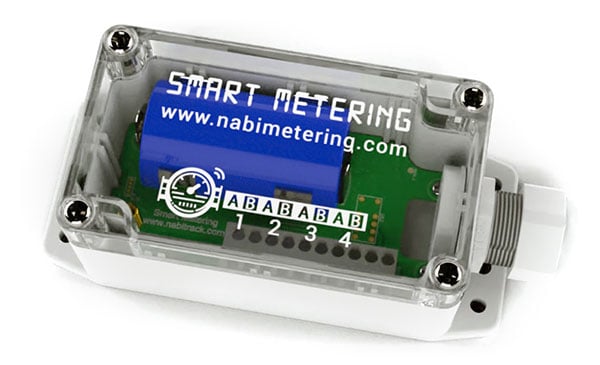
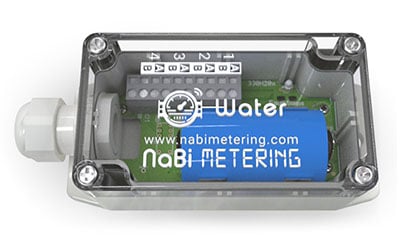
The simplest, ready to use smart device to measure water and electricity meters
In some cases the new energy prices demand more than this: let’s not just measure, but also intervene, i.e. develop building automation solutions at least for the large consumers.
As a living example, we saw that by continuously measuring two identical boilers, it was shown that the gas burner of one produced the same amount of heat from much more gas than the other one. Here, with an investment of the equivalent of a few hundred euros / dollars / British pounds – by changing the burner – it was possible to achieve a huge increase in efficiency, i.e. the use of the data brought a very quick return – even at the time of favorable energy prices.
Another interesting exapmle is when one of our customers had to pay a significant fine during the summer period due to the periodic exceeding of the contracted amount of electricity (amperage). With a smart meter, it was immediately visible with a minute breakdown that this excess happens every morning in the summer at the start of work – the day starts with good coffee, the tea maker also works well and, of course, when the equipment is turned on, they all start with maximum consumption. At that time, we suggested that the customer should turn off the central air conditioning for 30 minutes during this period, and it immediately fell back below the contracted power consumption level, and the penalty immediately disappeared.
Let our third example be a very simple case, when e.g. one or more toilets are leaking, or there is a broken pipe in the building. While this is easy to notice at home, it is not as easy on a large property. By making the meters smarter, with hourly, 10-minute or minute-based measurements, it becomes immediately visible if the water consumption never drops to zero, i.e. somewhere, something is leaking. In the best case, a toilet or a tap is the cause, but in the worst case, a broken pipe starts to wash away the building or destroys one of the structural elements.
These are just selected live examples and experiences, but what is also generally visible is that if the consumption is accurately charged to the users, real cost allocation is developed, then immediately the consumption drops by at least 10%, greener, sustainable operation becomes conscious.
The basis of all this is to know where our consumers are, where our meters are and, if possible, to know as precisely as possible how they are connected to each other. The OrthoGraph operational BIM is not the total solution here, but the necessary initial tool that enables the solution itself to perform, i.e. it will be necessary to develop the smartening system (again, let us emphasize that we speak about minutes/hours of development) of the given properties.

WALK-IN MAINTENANCE breakdown reporting
Defective or unmaintained equipment (e.g. air handlers with a clogged filter, improperly closing valves, “disappeared” radiator valves, etc.) quickly become a conspicuous energy user. Not only do they cost more to operate, but the level of service also quickly starts to drop because of them. It will be too cold or too hot, in the worst case, there will not be enough fresh air supply and the high CO2 level will also make colleagues sleepy or sick.
If the important maintenance points get unique, preferably RFID identifiers, which can be easily added to the digital twin of the operational BIM with the OrthoGraph system, then regular, controlled inspections can be set up, in which the maintainers can easily record where they see anomalies. In addition, we can be sure that the colleagues have actually visited the equipment by scanning their RFIDs and that something was not just written down on paper instead of being there.
Here, too, operational BIM only provides a required basis for better quality work, but in this example it will be the facility management software that can be used to plan, check and record the task of the walk-through.
FINAL WORD
These are just selected examples of how the energy consumption of properties can be reduced very quickly and very significantly with data. We are surprised every day by the creative ways in which our customers gain new benefits from their existing operational BIM files and we learn from them while we also support them with possible missing functions.
It should also be mentioned that the OrthoGraph operational BIM system, the facilities management system, the smartmeter data collection, energy management, analysis or automation systems are more than made only for energy consumption. They are required to create and measure the freed up energy budget, and by reusing the Operational BIM data, it immediately provides an opportunity for renovation, control of subcontracts, and optimization of real estate utilization. Thus, in general, not only is the change of energy prices can be saved, but much more, or even additional income can be generated with better real estate utilization, in addition to the better service levels – and all this with more sustainable operation than is happening today.

to our Newsletter
OrthoGraph
Contact us
Contact us
OrthoGraph GmbH
Gartenstrasse 7
Zug
Switzerland
6300
+ 41 (41) 5510150
9:00-18:00 Zurich Time
USA: +1 760 933 1550
UK : + 44 (20) 34119438
Other pages
Education
Rapid Survey Concept
Orthograph for Constructions
Historical Building Survey