
Creating meaningful reports is traditionally slow, expensive, and complex.
In most maintenance and facility management systems, even a simple custom report can require weeks of consultation and development, often costing thousands of euros.
With OrthoGraph, this changes fundamentally.
Reports created by simply asking
Our AI-powered reporting allows users to create reports by describing what they want in plain language.
→ No technical knowledge, no specifications, no back-and-forth with consultants.
Within seconds, the AI generates a working report that can be displayed as:
-
Structured tables for exact values and transparency
-
Interactive charts (bar, line, pie, radar, and more)
-
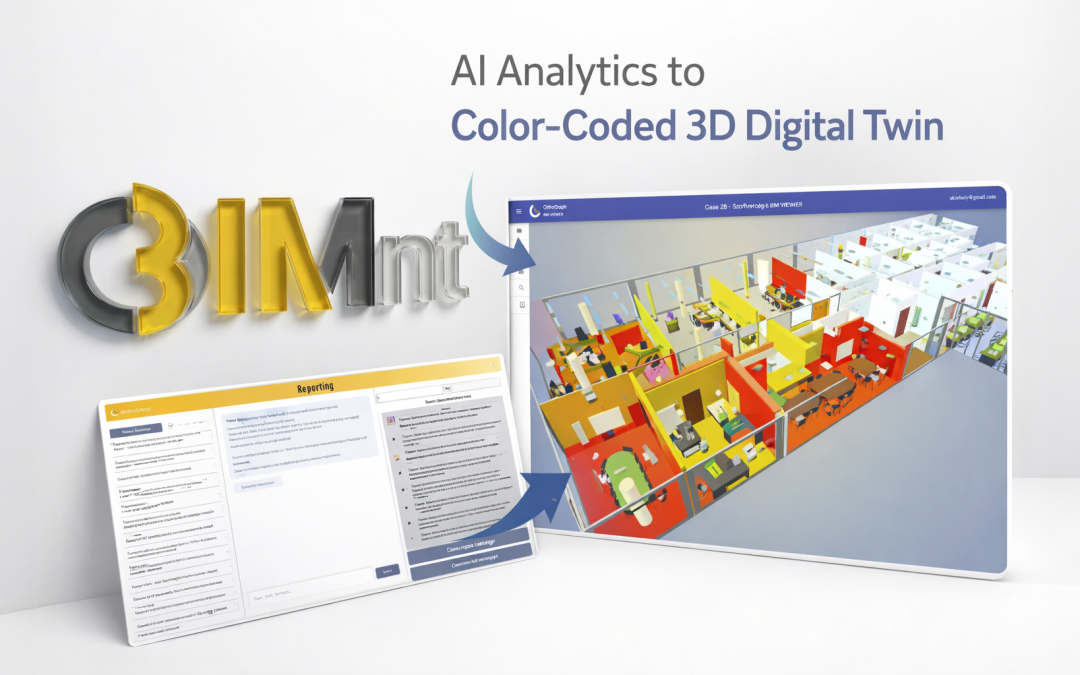
Floor-plan and 3D model coloring, fully integrated with our Operational BIM environment
The same data can be explored visually or analytically, depending on what the situation requires.


3D and floor-plan visualization – instantly
Report results can be mapped directly onto the building model:
assets, rooms, or areas are colored based on real data, making patterns, risks, and problem zones immediately visible.
In other systems, this level of visualization typically means a separate BIM project, custom development, and long lead times.
→ Here, it happens instantly, driven by AI.
Refine results through conversation
If the first result is not exactly what you need, simply continue the conversation.
You can:
-
adjust the logic,
-
change groupings,
-
switch visualization types,
-
or request additional explanations,
until the report matches your expectations perfectly.
→ There is no limit to how much you refine the report — the AI adapts in real time.
Immediate value, zero upfront cost
What usually requires:
-
multiple workshops,
-
custom development,
-
and significant consulting fees,
is available immediately and free of charge through AI-assisted reporting.
→ The result is faster insights, better decisions, and a reporting experience that finally keeps up with real operational needs.
Recent Comments